Overview #
The Directorist Analytics extension brings powerful insights and reporting features to your directory platform. You can monitor platform activity, understand visitor behavior, and track listing performance all from within your WordPress dashboard. The system collects and visualizes data on views, clicks, searches, referrals, and user actions, helping you make informed decisions to grow your directory.
The extension includes two dedicated analytics interfaces:
- Admin Dashboard – a global analytics hub for site owners to track platform-wide performance, user engagement, and top-performing listings.
- Listing Owner Dashboard Analytics – Phase 2 (Coming soon*)
Key Features #
- Admin Dashboard: Get a complete overview of your directory — total listings, reviews, active authors, and recent activities in one place.
- Listing Performance Tracking: Monitor key metrics such as listing views, search appearances, clicks, contact form usage, and website link visits.
- Visitor & Traffic Insights: Identify visitor locations, referral sources, browsers, and devices to understand audience behavior.
- Listing Owner Analytics: Each listing owner can view detailed performance data for their own listings, compare results, and improve visibility.
- Reports & Data Export: Generate reports by custom date range and export them in CSV or PDF formats for easy sharing or record keeping.
Installation & Configuration #
- Navigate to Directory Listings > Themes & Extensions
- Find “Directorist Analytics” and click Install and then Activate.
- A new menu will appear at Directory Listings > Analytics
For detailed installation and setup instructions, please visit the Installation Guide for Directorist Analytics page.
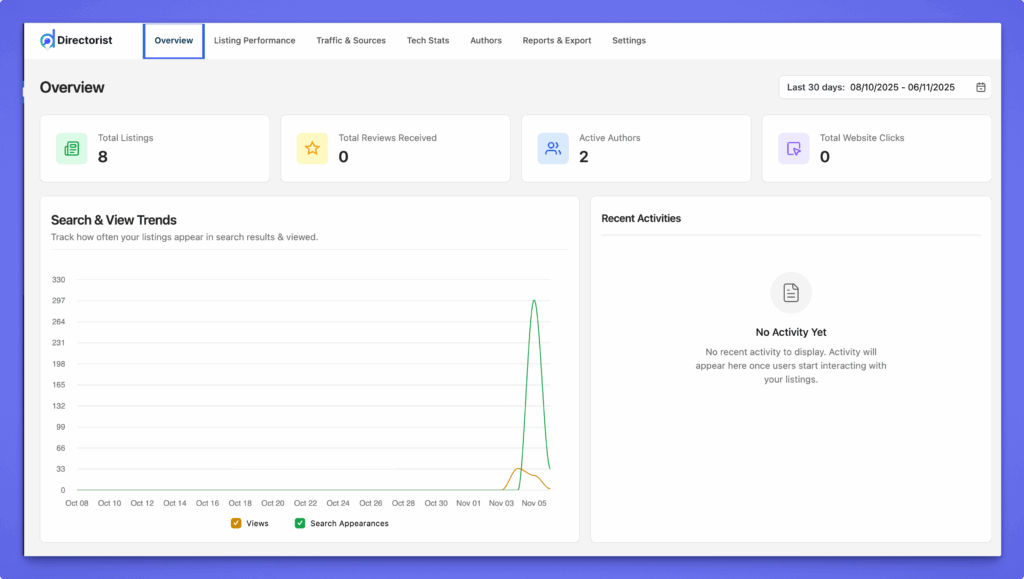
Overview Tab #
The Overview tab in Directorist Analytics provides a quick summary of your directory’s overall performance. It highlights total listings, reviews received, active authors, and total website clicks — giving you a clear snapshot of platform activity at a glance.
A time filter at the top right lets you view data from different periods (e.g., last 7, 30, or custom days).
Key Sections #
- Total Listings: Displays the total number of published listings on your site.
- Total Reviews Received: Shows how many reviews users have submitted.
- Active Authors: Indicates the number of users actively posting or managing listings.
- Total Website Clicks: Tracks how many times visitors clicked website links from listings.
Search & View Trends #
This chart visualizes how often listings appear in search results and how many times they are viewed over a selected period. You can easily compare trends between Views and Search Appearances to identify performance spikes.
Recent Activities #
Shows a list of the latest actions such as new listings, user signups, or reviews. When no recent events are available, it displays a “No Activity Yet” message until interactions occur.
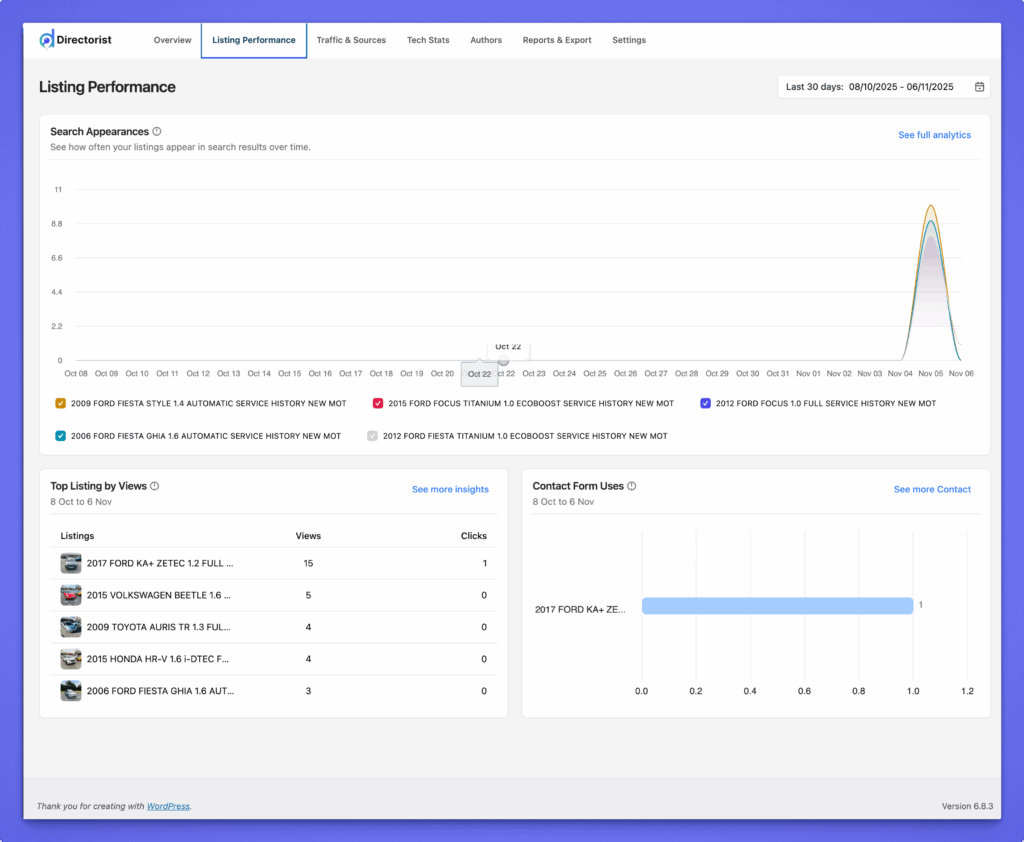
Listing Performance Tab #
The Listing Performance tab provides detailed insights into how individual listings are performing on your directory. It helps administrators owners understand visibility, engagement, and user interaction trends.
Key Sections #
- Search Appearances
Displays how often each listing appears in search results over time. The graph shows performance trends for all listings, helping identify which ones gain more exposure. - Top Listings by Views
Lists your most viewed listings for the selected period. You can track both views and clicks, making it easier to identify high-performing or underperforming listings. - Contact Form Uses
Shows how many times users reached out via the listing’s contact form. This helps you measure engagement and lead generation from each listing.
Each data section can be expanded for more detailed analytics, and the time range filter at the top right allows viewing performance for specific periods.
Traffic & Sources Tab #
The Traffic & Sources tab gives you a clear view of where your visitors come from and how they find your listings. It helps you understand the geographical reach of your directory and the channels that drive the most traffic.
Note: The Traffic & Sources data is collected based on single listing page views.
To track views from logged-in users as well, go to Directory Listings → Settings → Listings → General and enable “Include Logged-In User Views.”

Key Sections #
- Top Countries by Visitors
Displays a world map and a ranked list of countries with the highest number of visitors. You can quickly see your top-performing regions along with their percentage share of total traffic. - Top Search Engines
Shows which search engines (e.g., Google, Bing, Yahoo) are sending users to your directory. This data helps identify how well your listings are performing in organic search. - Top Referral Sources by Visitors
Lists external websites and platforms (like Facebook, Google, YouTube, or partner sites) that refer visitors to your directory. This helps you recognize valuable traffic sources and optimize promotional strategies.
Each chart includes traffic counts, share percentages, and visual indicators for easy comparison.
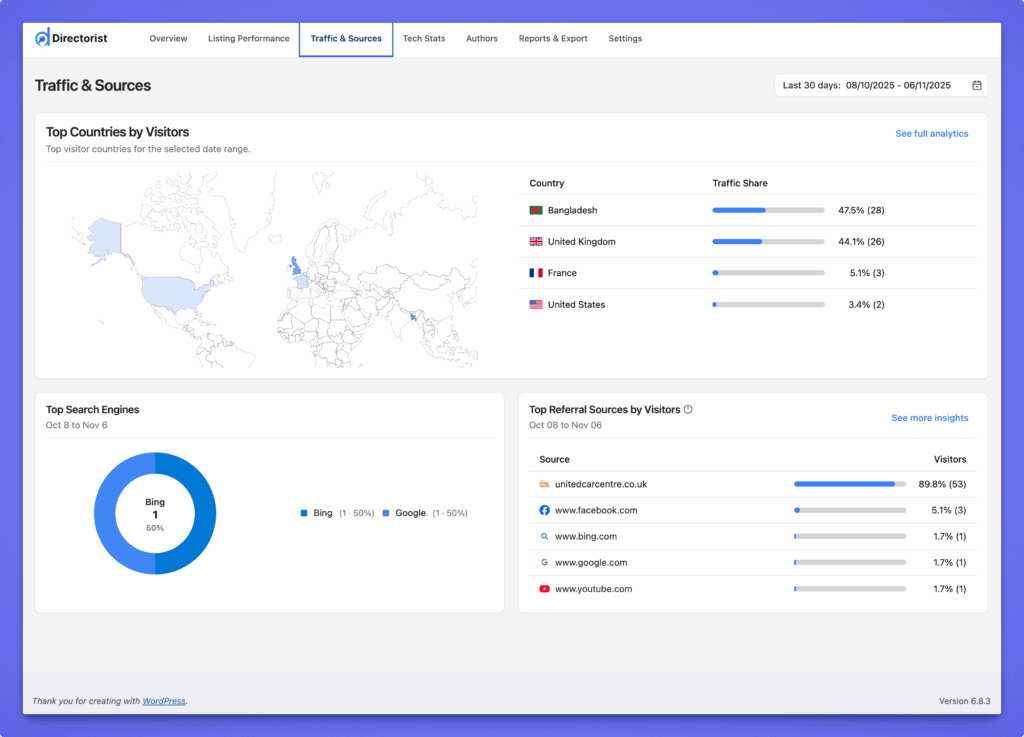
To view complete analytics and deeper insights for each section, click the “See more insights” button.
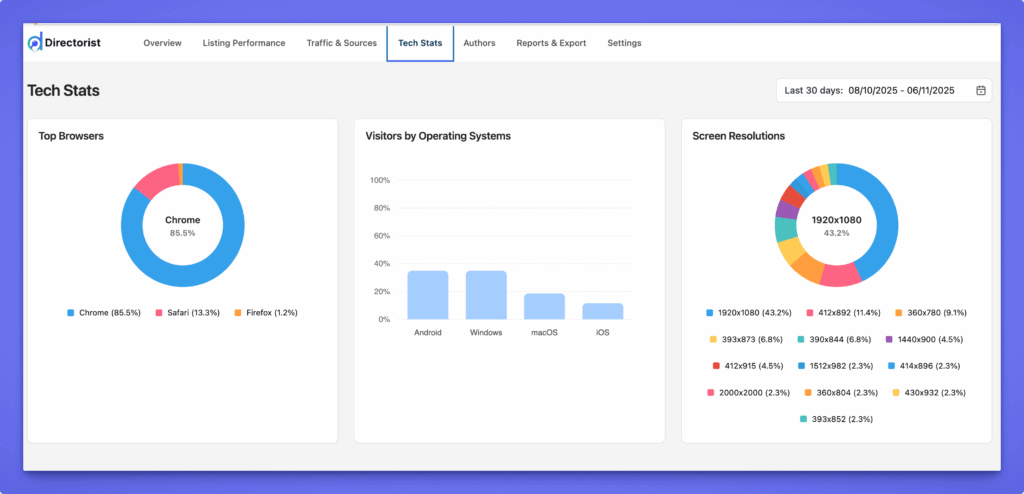
Tech Stats Tab #
The Tech Stats tab provides technical insights into how visitors access your directory. It helps you understand which browsers, operating systems, and screen resolutions your audience uses, allowing you to optimize your site for better performance and compatibility.
Note: The Tech Stats tab data is collected based on single listing page views.
To track views from logged-in users as well, go to Directory Listings → Settings → Listings → Badges and enable “Include Logged-In User Views.”
Key Sections #
- Top Browsers
Shows which browsers (e.g., Chrome, Safari, Firefox) visitors use most often. This helps identify the primary environments your directory should be optimized for. - Visitors by Operating Systems
Displays the distribution of visitors based on their devices and operating systems, such as Android, Windows, macOS, and iOS. - Screen Resolutions
Visualizes the screen sizes most commonly used by visitors. This helps ensure your directory layout remains responsive and visually consistent across devices.
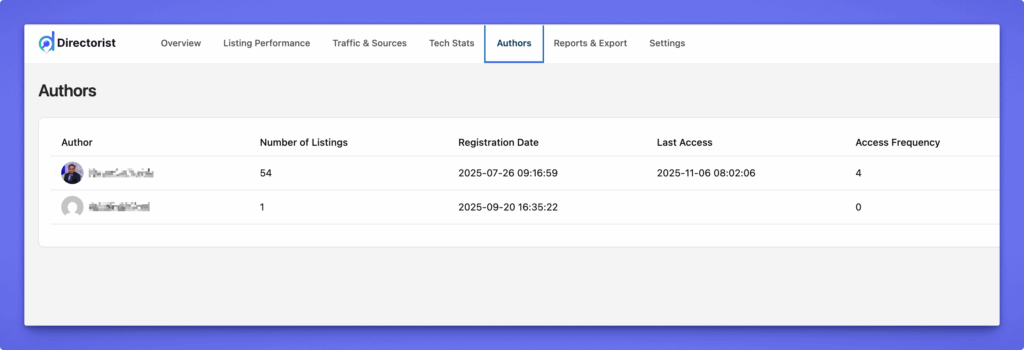
Authors Tab #
The Authors tab provides insights into all registered listing authors on your directory. It helps administrators track user activity, monitor engagement levels, and identify active or inactive contributors.
Key Sections #
- Author List
Displays a complete list of authors along with their profile photo and name for quick identification. - Number of Listings
Shows how many listings each author has published, helping admins assess user contribution levels. - Registration Date
Indicates when each author first registered on the platform. - Last Access
Displays the most recent login date and time, allowing admins to monitor user activity and retention. - Access Frequency
Counts how many times each author has logged into their account, providing insights into engagement and participation.
You can sort or review the table to quickly identify your most active or inactive listing authors.
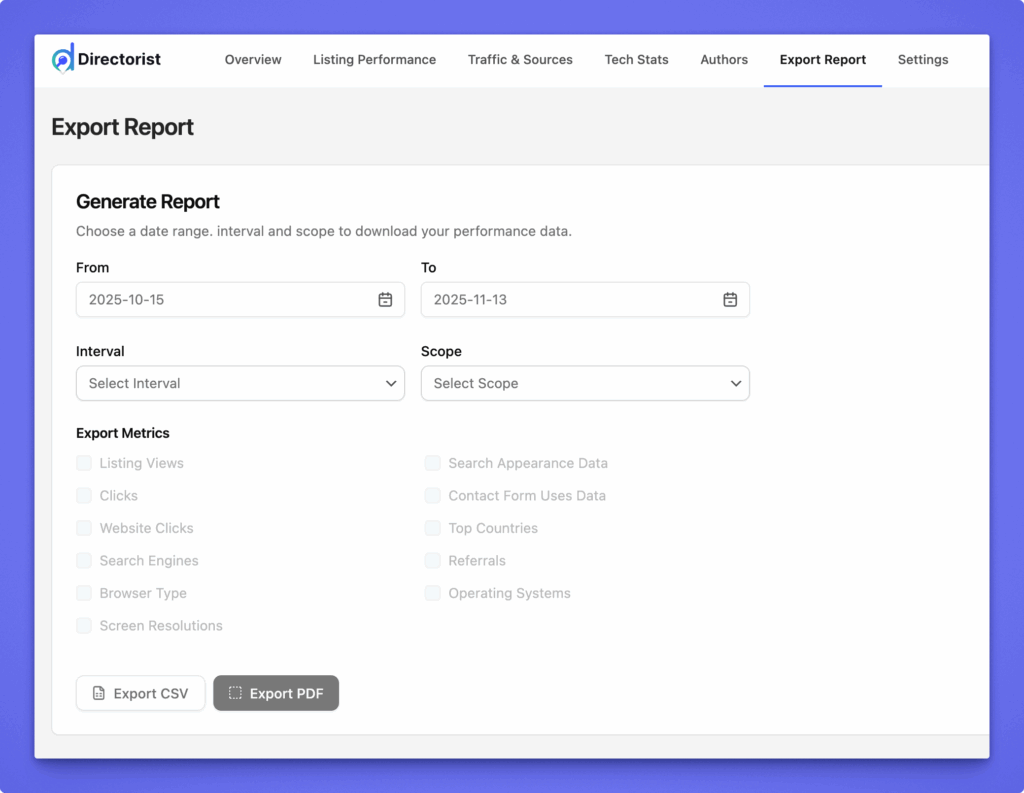
Reports & Export Tab #
The Reports & Export tab allows you to generate detailed analytics reports for listings, authors, or the entire directory. You can define the time range, select data intervals, and choose the specific metrics you want to include in your report.
Key Sections #
- Date Range
Set the start and end dates to define the period for your analytics report. - Interval
Choose how you want the data grouped — for example, daily, weekly, or monthly — to analyze performance trends over time. - Scope
Select what the report should focus on:- Per Listing: Generate analytics for individual listings.
- All Listings: View combined performance across all listings.
- Per Author: Track engagement and activity for specific authors.
- Export Metrics
Pick the types of data to include in the report, such as listing views, clicks, search appearances, referrals, contact form usage, and technical stats (browser, OS, screen resolution). - Export Options
Once configured, you can download the report in CSV or PDF format for sharing, record-keeping, or client reporting.
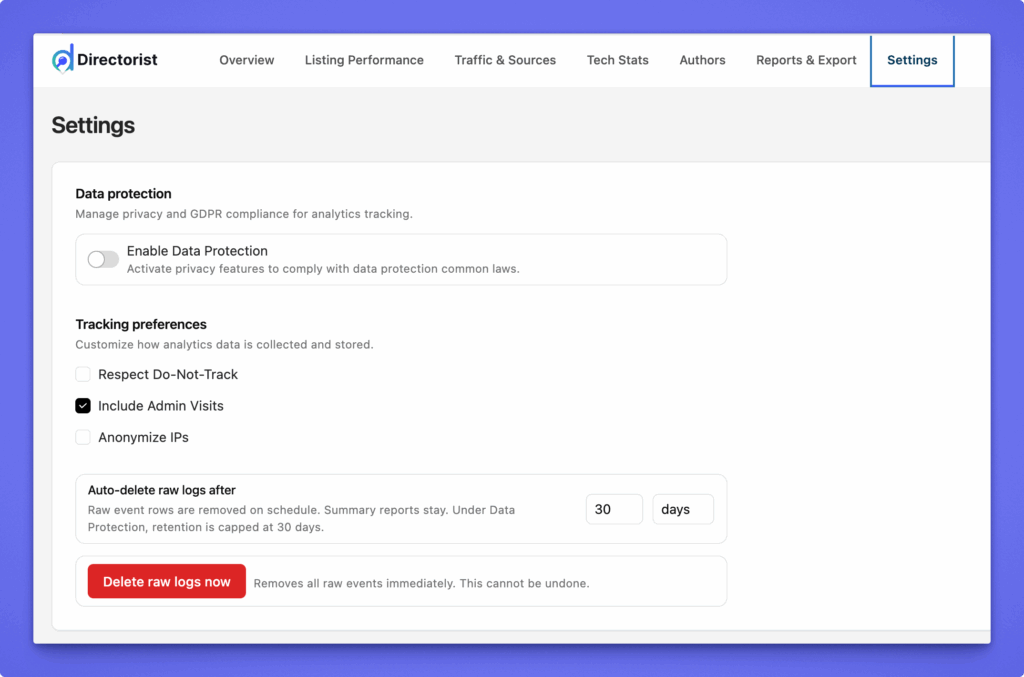
Settings Tab #
The Settings tab lets administrators manage data privacy, tracking preferences, and data retention policies for Directorist Analytics. These options ensure compliance with privacy laws while maintaining full control over how analytics data is collected and stored.
Key Sections #
- Data Protection
Enable privacy and GDPR compliance by activating Data Protection. When turned on, the system automatically limits data collection based on common data protection standards. - Tracking Preferences
Fine-tune what kind of data gets tracked:- Respect Do-Not-Track: Honors browser-based privacy preferences.
- Include Admin Visits: Counts visits from logged-in administrators (useful for testing).
- Anonymize IPs: Masks visitors’ IP addresses to enhance user privacy.
- Auto-Delete Raw Logs
Automatically delete detailed event data after a set number of days. Summary reports remain intact for long-term analysis.- You can set the number of retention days (default: 30 days).
- Use Delete raw logs now to instantly remove all stored raw data. (This action is irreversible.)
That’s all for the Directorist Analytics extension overview and feature guide. Need help setting up? Contact our support team for assistance.


